Crypto folklore has strong opinions about the Moon — "buy the full moon, sell the new moon" (or was it the other way around?) has been recycled through trading forums for years. Rather than argue about it, we built a chart that lets you look at Bitcoin moon phases directly, and we even tested 109 full and new moons ourselves — that post has the analysis. This one is the companion how-to: how to actually read the moon cycle chart, what the markers mean, and how to check the folklore with your own eyes.
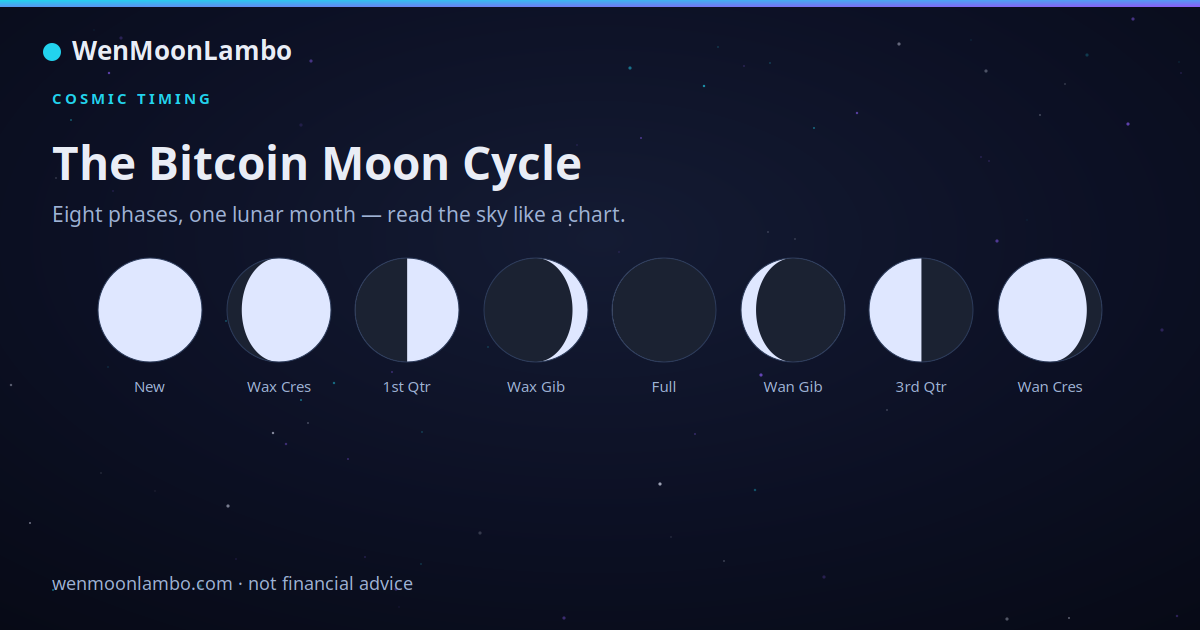
Bitcoin moon phases: what the moon cycle chart shows
The moon cycle chart lives on the astrology page, and its backbone is the illumination curve — a smooth wave showing what fraction of the Moon's face is lit on each date, from 0% at new moon up to 100% at full moon and back down again. If you've never seen the lunar cycle drawn as a line, it's satisfying: a clean, endlessly repeating wave, which is more than you can say for anything else in crypto.
On top of that curve sit the event markers:
- Full moon markers at each peak of the curve — the Moon fully lit.
- New moon markers at each trough — the Moon dark.
- Blue and black moon highlights flagging the calendar oddities (more on those below).
Because the Moon's cycle is astronomy, not opinion, everything on this chart is precisely predictable — past and future. The lore attached to it is another matter, which is exactly why the chart exists.
Lunation dates, explained
A lunation is one complete lunar cycle: new moon to the next new moon. Astronomers call it the synodic month, and it runs about 29.5 days on average.
That half-day-short-of-thirty length is the source of every quirky moon date you've ever noticed. Because a lunation doesn't fit evenly into our calendar months, the full moon lands on a different date each month, drifting steadily through the calendar. String a year together and you get either 12 or 13 full moons — the leftover fractions add up.
When people talk about "lunation dates" in market lore, they usually mean the anchor points of the cycle: the exact dates of each new and full moon. Those are the dates marked on the chart, and they're the dates any moon-based market claim ultimately hangs on. If someone says "Bitcoin does X around the full moon," the lunation dates are the checkable half of that sentence.
Blue moons, black moons and other calendar quirks
Two bits of moon trivia earn their own markers on the chart, and both are artifacts of that 29.5-day cycle rubbing against our calendar.
A blue moon, in the most common modern usage, is the second full moon to land inside a single calendar month. Squeeze a full moon into the first day or two of a month and the ~29.5-day cycle can deliver another before the month ends. (An older, seasonal definition — the third full moon in a season that has four — also floats around; the chart uses the calendar version.) The Moon does not actually turn blue. Sorry.
A black moon is the mirror image: commonly, the second new moon in a single calendar month.
Neither event looks any different in the sky, and neither has any astronomical significance beyond calendar bookkeeping. But rarity breeds mystique, and market folklore loves a rare event — which makes these markers useful precisely because you can see how arbitrary they are.
How to overlay price on Bitcoin moon phases — and check the lore yourself
Here's where the chart earns its keep. You can lay Bitcoin's price over the illumination curve and inspect the folklore directly: find each full moon marker, look at what price actually did around it, repeat across many cycles.
A few honest ground rules for playing armchair researcher:
- Look at many events, not a few. Any handful of full moons will include some where price rose and some where it fell. Cherry-picking three good ones proves nothing — that's true of moon phases and of every indicator ever invented.
- Decide the claim before you look. "Price rises in the three days after a full moon" is checkable. "The Moon influences markets" is not — vague claims can never lose, which is exactly what's wrong with them.
- Watch your own eyes. Confirmation bias means you'll feel the hits more than the misses. Counting beats feeling, every time.
That discipline — stated claim, full sample, honest count — is just backtesting etiquette, and it's the same habit taught in our free TA course. If you want the formal version applied to this exact question, that's what the 109 full and new moons analysis is for. We'd rather you read the method than take anyone's word for the conclusion — ours included.
The bottom line
The moon cycle chart is astronomy with a price feed: a precise illumination curve, exact lunation dates, and honest markers for the blue and black moon oddities, all sitting under real Bitcoin data. The Moon's schedule is the one thing in crypto you can predict to the minute — whether it predicts anything else is a question you now know how to investigate properly.
So next full moon, skip the forum argument. Pull up the chart, count honestly, and if the lore inspires a trade idea, test it where mistakes are free — a practice account comes with $10k in play money on live market data, and the Moon charges nothing for the lesson.
The esoteric layer on WenMoonLambo is entertainment — a lens for curiosity, not trading advice.
Nothing here is financial advice. WenMoonLambo is a paper-trading platform — all trading happens with play money on real market data.